The examples below are based on the “Explore – All records” part of iRecord, but most of this also applies to “Explore – My records”.
Note that when you add a record to iRecord, there will be a short delay before it appears on the All records and My records pages. This delay is usually around 15 minutes, depending on how busy the system is. (If you need to see a record immediately after it has been added you can use an older version of the Explore all and Explore my pages, but note that these have limited functionality and may run slowly.)
The Explore page layout
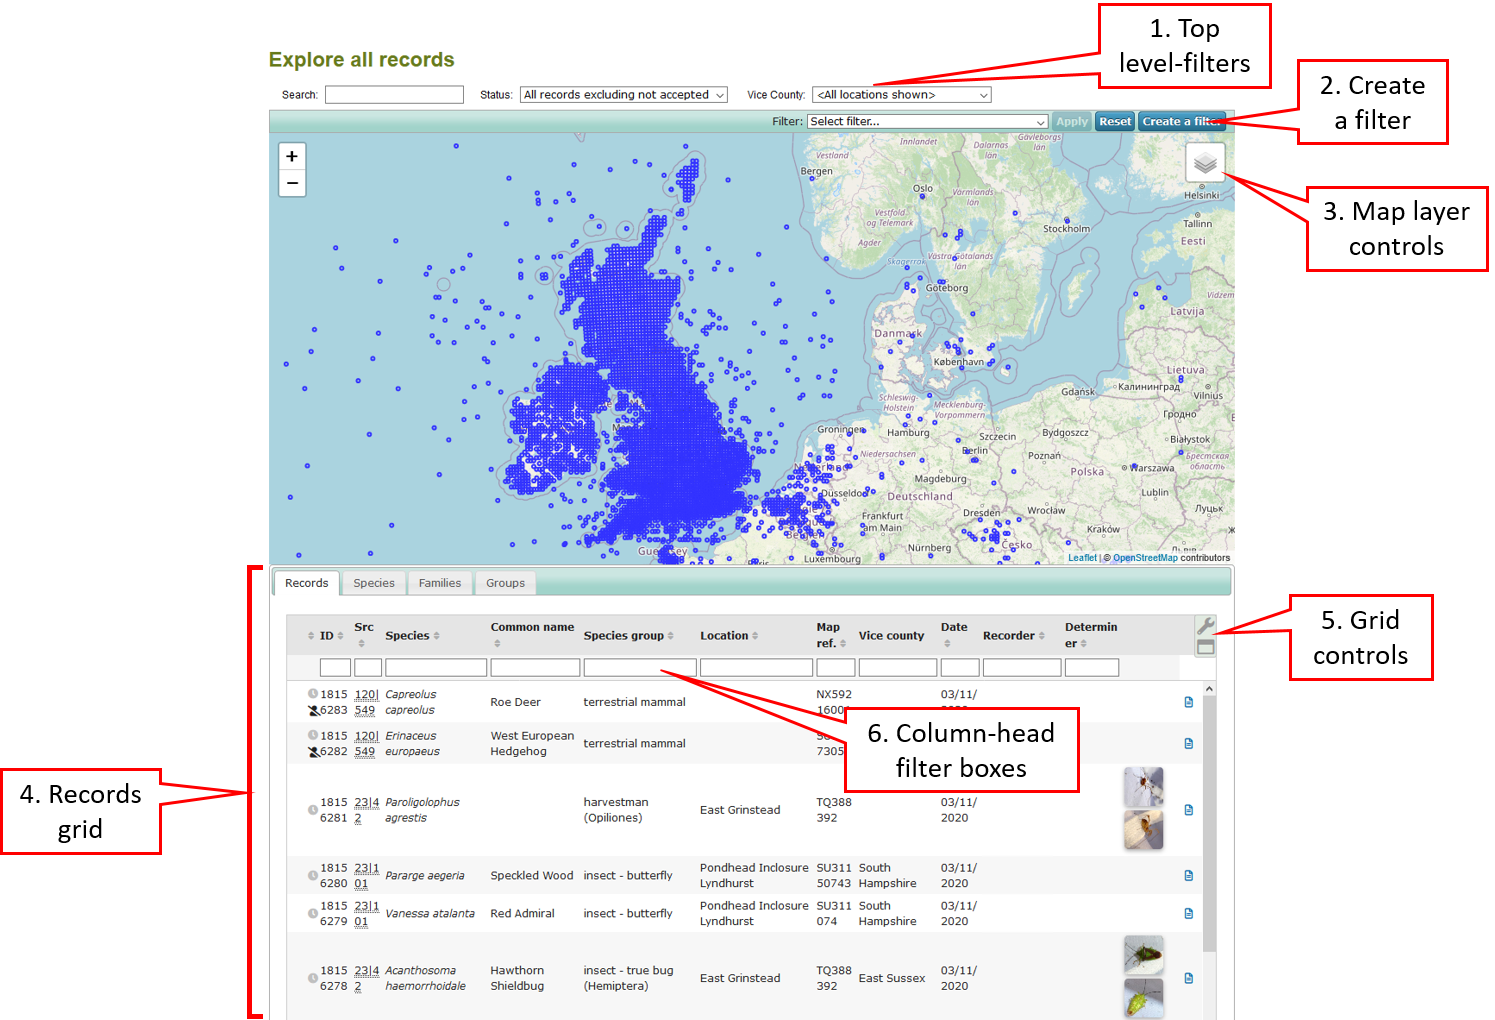
From the “Explore” menu at the top of the page, go to “All records”. You’ll see a map display, with records listed underneath. The main elements of the Explore pages are shown here:
Jump to:
| 1. Top level filters | 4. Records grid |
| 2. Create a filter | 5. Grid controls |
| 3. Map and layer controls | 6. Column-head filter boxes |
1. Top level filters
There are three filters at the top of the page that can be quickly and easily applied.
Search box
This can be used to search for any text in any part of any record. For instance, searching for the word "common" will produce records of Common Blue butterfly (and damselfy), records from sites such as Cotswold Commons, records with the word common in the comment boxes, etc. This provides a quick way of narrowing down the set of records, but is not very precise. To search for words in particular columns within the record grid you can specify a more precise search - for more information see the Help page on Using the Elasticsearch search box.
Status
This allows a quick choice between viewing different sets of records based on their verification status, e.g. you can restrict your view to "Accepted" records only, or "All" records, etc. For more on what these terms mean see our Help page on Verification: what, who and why.
Vice County
Enables a quick choice of a single vice-county.
See also section 6, Column-head filter boxes, for additional quick filter options.
2. Create a filter
Click on the "Create a filter" button to open up a more comprehensive set of filter options. These take time to set up, but can be saved for future use. For a quicker filtering method see section 6 below.
What
Click on “What” to filter by species group, or by order, family, genus or species etc. To find the group you are looking for, you may need to use asterisks as “wildcards” around the name you are typing. For example, if we want to filter to see butterfly records:
- Type in *butterfly* (with asterisks) in the Species groups box
- The lookup list list will show “insect – butterfly”. Click on “insect – butterfly” to fill in the box
- Click on the “Add” button
- Click on the “Apply” button.
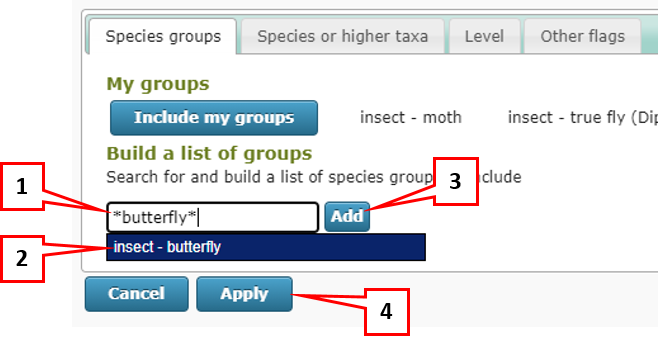
Your map and records should now be showing butterfly records.
The other tabs work in much the same way. To filter for a taxon Order, Family or Genus or species use the "Species or higher taxa" tab. You can type in scientific or English names to find a particular species, and the asterisk wildcard can be used here as well.
The "Level" tab allows you specify whether you want to include or exclude records at genus or subspecies level etc. The "Other flags" tab allows you to include or exclude marine species.
Where
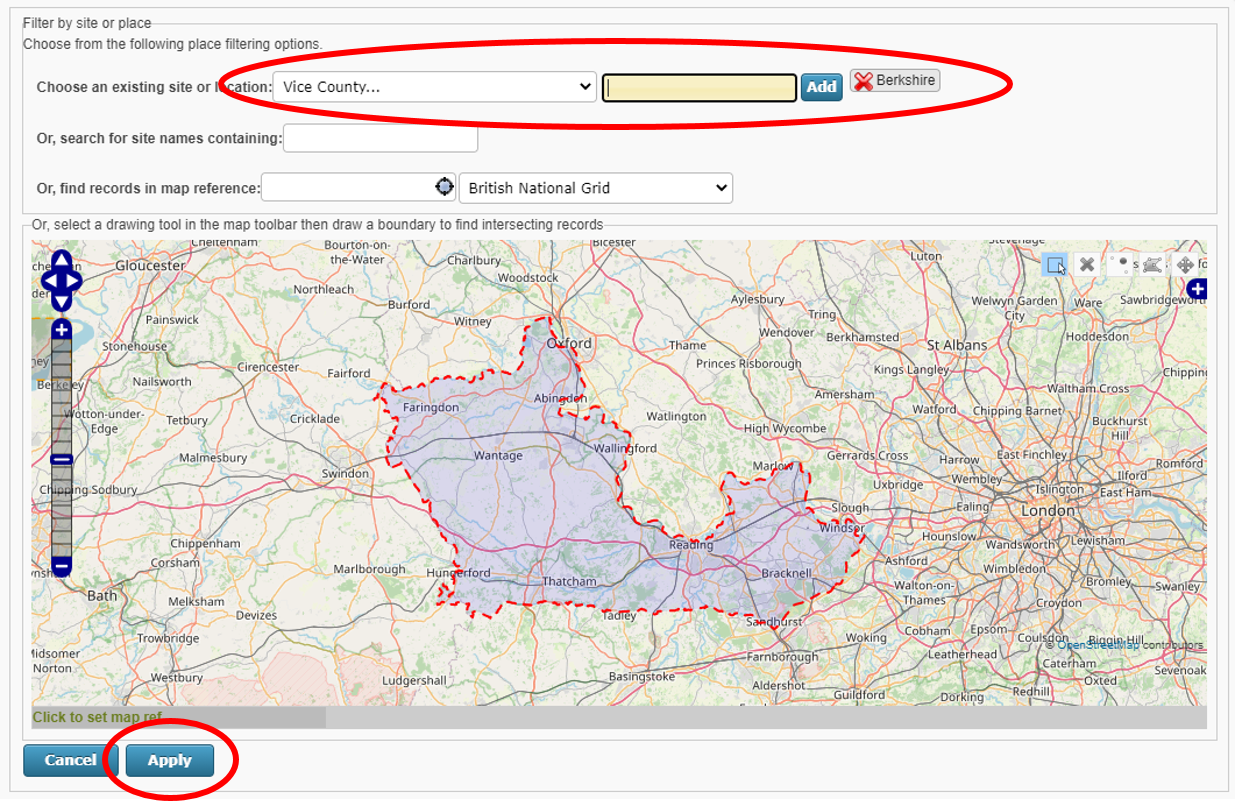
Click on “Where”. In the box for “Choose an existing site or location” there are various types of site to choose from. We’ll use “Vice County” for this example – click on that.
You now need to type in the name of the county you want – you may find it helpful to use the asterisk wildcard again, e.g. try typing *yorkshire. Once you’ve found the county you want, click on it, then click Add. You can select more than one county, using the Add button each time. Once you have chosen the area or areas that you want, click on the Apply button to save your selection.
If you don’t want to filter by county or site go back to the “Choose an existing site or location” box and click on <Please select>, and then on Apply.
You can also filter sites by site name. Or you can draw your own area to select the records that overlap it, using the tools at the top right of the map:
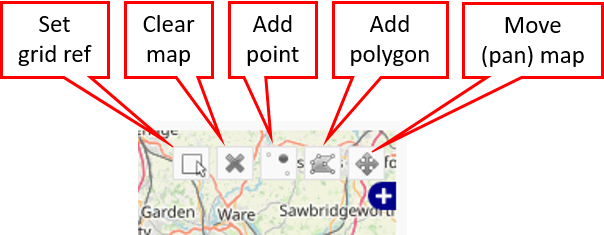
If drawing a polygon, double-click one the final point to close the polygon.
When
You can set a filter to include records for a particular time period, with these options:
- Date field - specify whether you want to filter by the date of the sighting, or the date of adding the record to iRecord, or date of last edit or verification
- Records from and Records to - the time period you are interested in
- Max. record age - an alternative to specifying Records from and to: just give a number followed by the unit (days, weeks, months or years), e.g. "2 days" or "1 year".
Who
A simple filter that allows you to restrict the display to show only your own records - in effect this changes the "Explore All records" page so that it becomes the same as the "Explore My records" page.
Record ID
This allows you to filter for a particular record, if you know the ID number for that record, or to use the ID numbers to filter out all the records since a particular record.
Quality
By default, this filter is set to show you all records except those that have been marked as “Not accepted” by one of the verifiers on iRecord (for more on what these terms mean see our Help page on Verification: what, who and why). You can change this setting, or you can filter to only show records that have photos attached to them.
You can also filter for various levels of identification difficulty (but not all species have had difficulty levels set, so this filter may give unexpected results).
Source
This filter allows you to include, or to exclude, records from particular sources. You can choose to include/exclude from an entire contributing website, from a particular survey within one of the websites, or from a particular recording form within a survey.
Saving your filter
Having set up a filter for a particular set of records, you can save that filter (e.g. if it is one that you will want to re-use in future). Give it a name in the “Save filter as” box, and then click on the blue Save icon:
3. Map and layer controls
The top half of the Explore page shows a map of all the records currently being displayed. In the top-right corner of the map there are some layer controls. Move your mouse cursor over the layer control icon and you will see a set of choices:
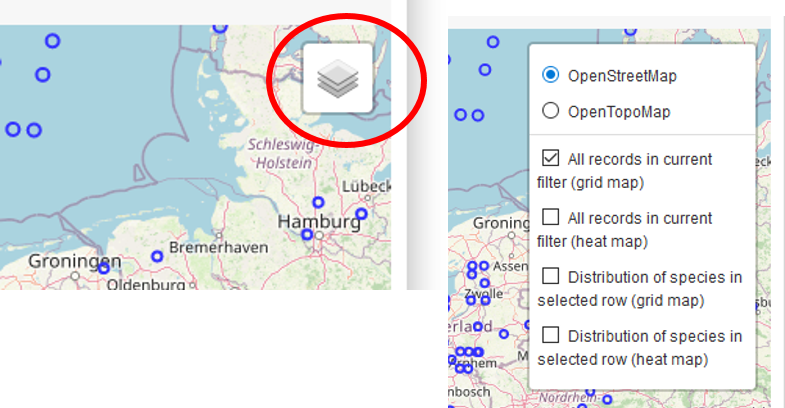
The top two choices allow you to switch between the standard OpenStreetMap background or an OpenTopoMap background.
The other tick boxes affect how the records are displayed on the map - you can choose one or more:
- All records in current filter (grid map) - shows blue circles for each record in the grid
- All records in current filter (heat map) - also shows all records in the grid, but as a heat map, with darker colours where there are more records
- Distribution of species in selected row (grid map) - if you click on any record in the grid, that individual record will be highlighted on the map, and you will see red circles for all other records of the same species. When you click on a different record for a different species, the red circles will update to show the new species.
- Distribution of species in selected row (heat map) - as above, but with heat map display
4. Records grid
This provides a list of the records that match the current filter settings, and are shown on the map. You can choose which columns are included in this grid (see section 5 below).
The grid can be sorted by clicking on any one of the column headings. For example, click on the "Species" heading to sort all the records alphabetically by species name:

Click the column heading a second time to put the list into reverse alphabetical order.
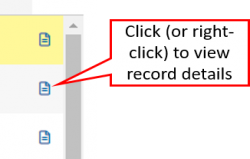
To the right of each row in the records grid you will see one or two small icons - if you are using "Explore - all records" there will just be one icon to allow the record details to be viewed, or if you are using "Explore - my records" you will have an icon to view each record and another to edit each record.
Click on the icons to open up the full record details. You may prefer to right-click on this icon (Ctrl+click on Mac) and 'open in a new tab' so as to avoid losing your filtering on the Explore page. (Note that some records that were entered on websites that share their records wtih iRecord will not have a details page available.)
At the foot of the records grid you can navigate backwards and forwards between the pages of records, and you can also specify how many records you want to see on the individual pages (30, 60 or 120 rows per page):
5. Grid controls
At the top-right of the records grid there are two icons that allow you to change the appearance of the grid:
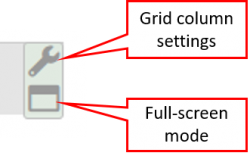
Full-screen mode
Click on full-screen mode to open up the grid into a full-screen display. To return to the normal display click the full-screen icon a second time, or press Escape on your keyboard.
Grid column settings
The grid column settings allow you to choose which columns appear in the grid. Click on the spanner icon and you will a list of all the different columns that are available. Tick the box next to each column that you wnat to include. If you tick lots of columns your grid may end up being very congested and difficult to read, so it is worth experimenting to find the most useful set of columns. Once you have made the choice it should be remembered so that the same choice reappears next time you visit the Explore page.

In the grid column settings you can also change the order in which the columns appear. Click and drag on any of the ticked column headings to move them up or down the list. Once you are happy with your chosen columns, click on "Save". If you want to get back to the default set of columns click on "Restore defaults" and then click "Save".
Grid tabs
When you first go to the Explore page the grid will be showing you the list of records, with one row per record. There are also tabs that shows lists of species, or families, or taxon groups - click on the tab you want to see:
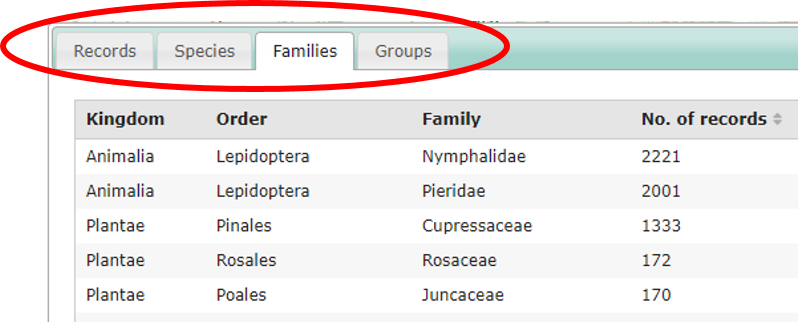
Note that there are some differences in the way the Records tab operates compared to the other tabs:
- Records tab: you can use the previous and next buttons to navigate through the list of records and view them onscreen; you cannot download the individual records from the "All records" view (however, you can download your own records from the "My records" view).
- Species, Family and Groups tabs: there are no previous and next buttons, so if your list of Species does not fit on one page you will not be able to see it onscreen. However, you can download these tables and see the full lists that way.
6. Column-head filter boxes
The filter settings described under top-level filters (section 1) and create a filter (section 2) can be applied to your “All records” view and will stay until you change them, or move away onto another page. This means that having set up your filter, you can use all the tabs (section 5) to look at Records, Species, Taxon groups etc.
There is a second way to quickly filter records on a temporary basis, by using the empty white boxes underneath the column headings. For example, I can add a temporary filter to limit the grid to records of "Peacock":
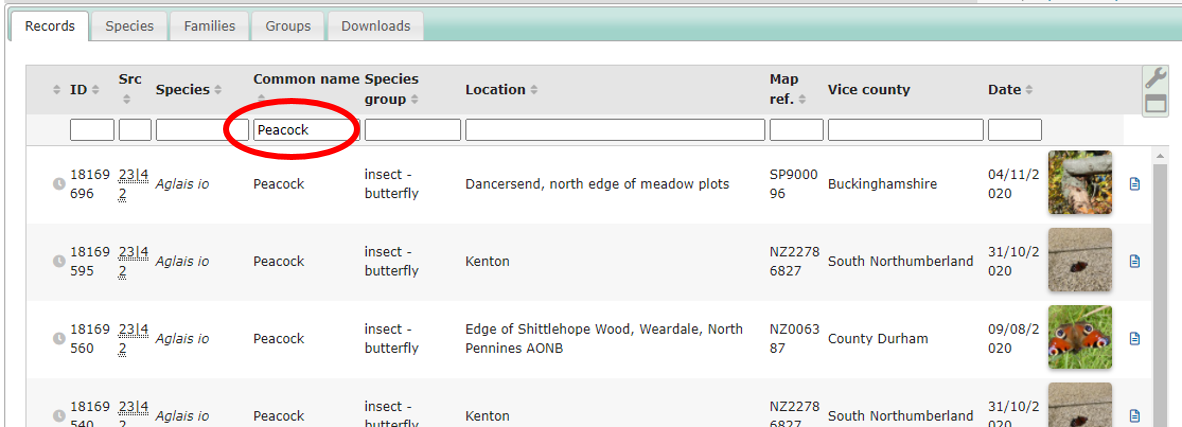
For this to work, you have to type in to the white box at the top of the column you want to filter, and then to make the filter take effect you have to click in a different box (or use the tab key), to come out of the box that you were typing in to.
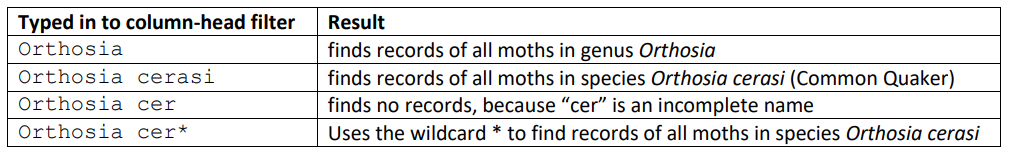
You can use partial names and wildcards to achieve different results. Here's an example for moths in genus Orthosia:
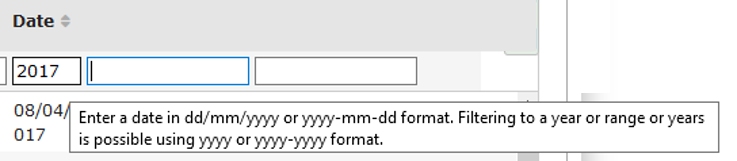
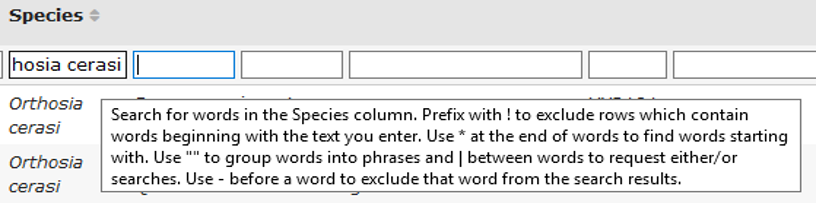
There are other options that allow you to include or exclude certain words, or to filter for dates or years. To see what options are available, position your mouse cursor over the column-head filter box and view the information that pops up. Here is an example for the species column:
Another example, for the date column: